After conexion, this service provides the enduser with statistics calculated on demand, characterising the evolution of spectral temporal composites for a chosen index in a chosen date-to-date time period.
The statistics are calculated in uploaded or on-screen plotted polygons or transects.
The enduser can:
- Upload his/her own area(s) of interest into the platform: polygon(s) or transect(s)
- Plot his/her own area(s) of interest on screen: polygon(s) or transect(s)
- Set a date-to-date calculation period
- Set the temporal composite (periodicity) spectral index of his/her choice as input
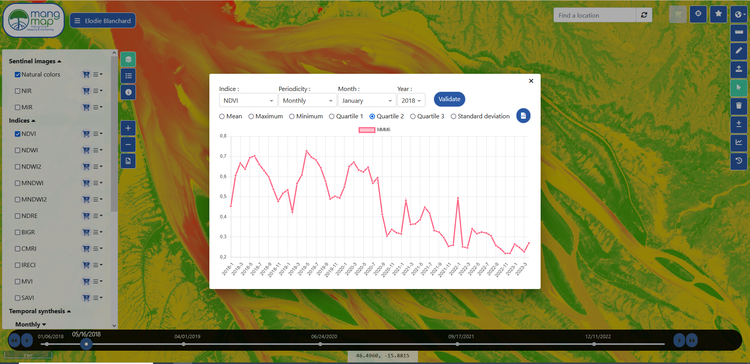
Statistics in Polygons
Instructions
- Upload or plot one or more polygons on screen
- Select one or more of the uploaded or plotted polygons
- Activate the "Statistics" function
- Select a spectral index
- Select the statistic to be calculated: mean, standard deviation, minimum, 1st quartile, median, 3rd quartile and maximum
- Select the periodicity of the temporal composite: monthly, quarterly, half-yearly, annual
- Set the start date (month and year): the statistics will be calculated between the chosen date and the most recent available temporal composite
- Run computation
As a result, this MangMap service offers:
- A table of values for each polygon
- An on-screen graph showing the variation of values over time
- The option of selecting a curve and reading along the curve: statistical value of the polygon (ordinate) over time (abcissa)
- Download the table of calculated statistical values in .csv format and the graph displayed in PNG, JPEG and PDF formats
Illustration :
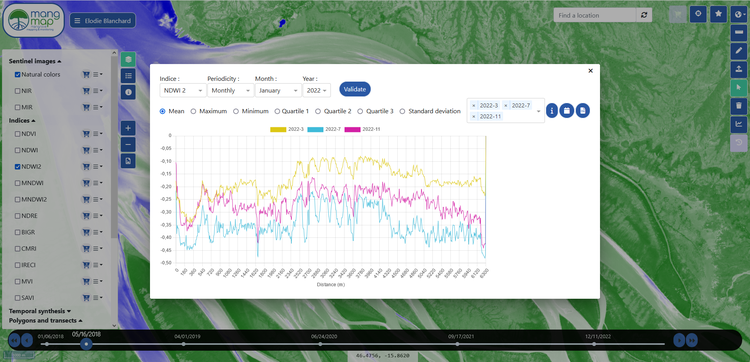
Statistics along Transects
Instructions
- Import or plot on screen one or more transect(s)
- Select one or more transects
- Select a spectral index
- Select the statistic to be calculated: mean, standard deviation, minimum, 1st quartile, median, 3rd quartile and maximum
- Select the periodicity of the temporal composite: monthly, quarterly, half-yearly, annual
- Set the start date (month and year): the statistics will be calculated between the chosen date and the most recent available temporal composite
- Run computation
As a result, this MangMap service offers:
- A table of values for each transect
- An on-screen graph showing the variation of values in space along the transect
- The option of selecting a curve and reading along the curve: distance from transect start point (abcissa) over statistical pixel value (ordinate)
- Download the table of calculated statistical values in .csv format and the graph displayed in PNG, JPEG and PDF formats
Illustration :