After conexion, this service enables endusers to generate an indicator of changes in mangrove areas: an estimate of the surface area balance between two dates.
The enduser can:
- Digitize a polygon of his/her choice on the screen in which to apply the calculation
- Choose a time period
Instructions
- Import your zone(s) of interest into the platform, or digitize them on screen
- Select the polygon of your choice
- Activate the "Reports" function
- Select a start and end date
- Run the calculation
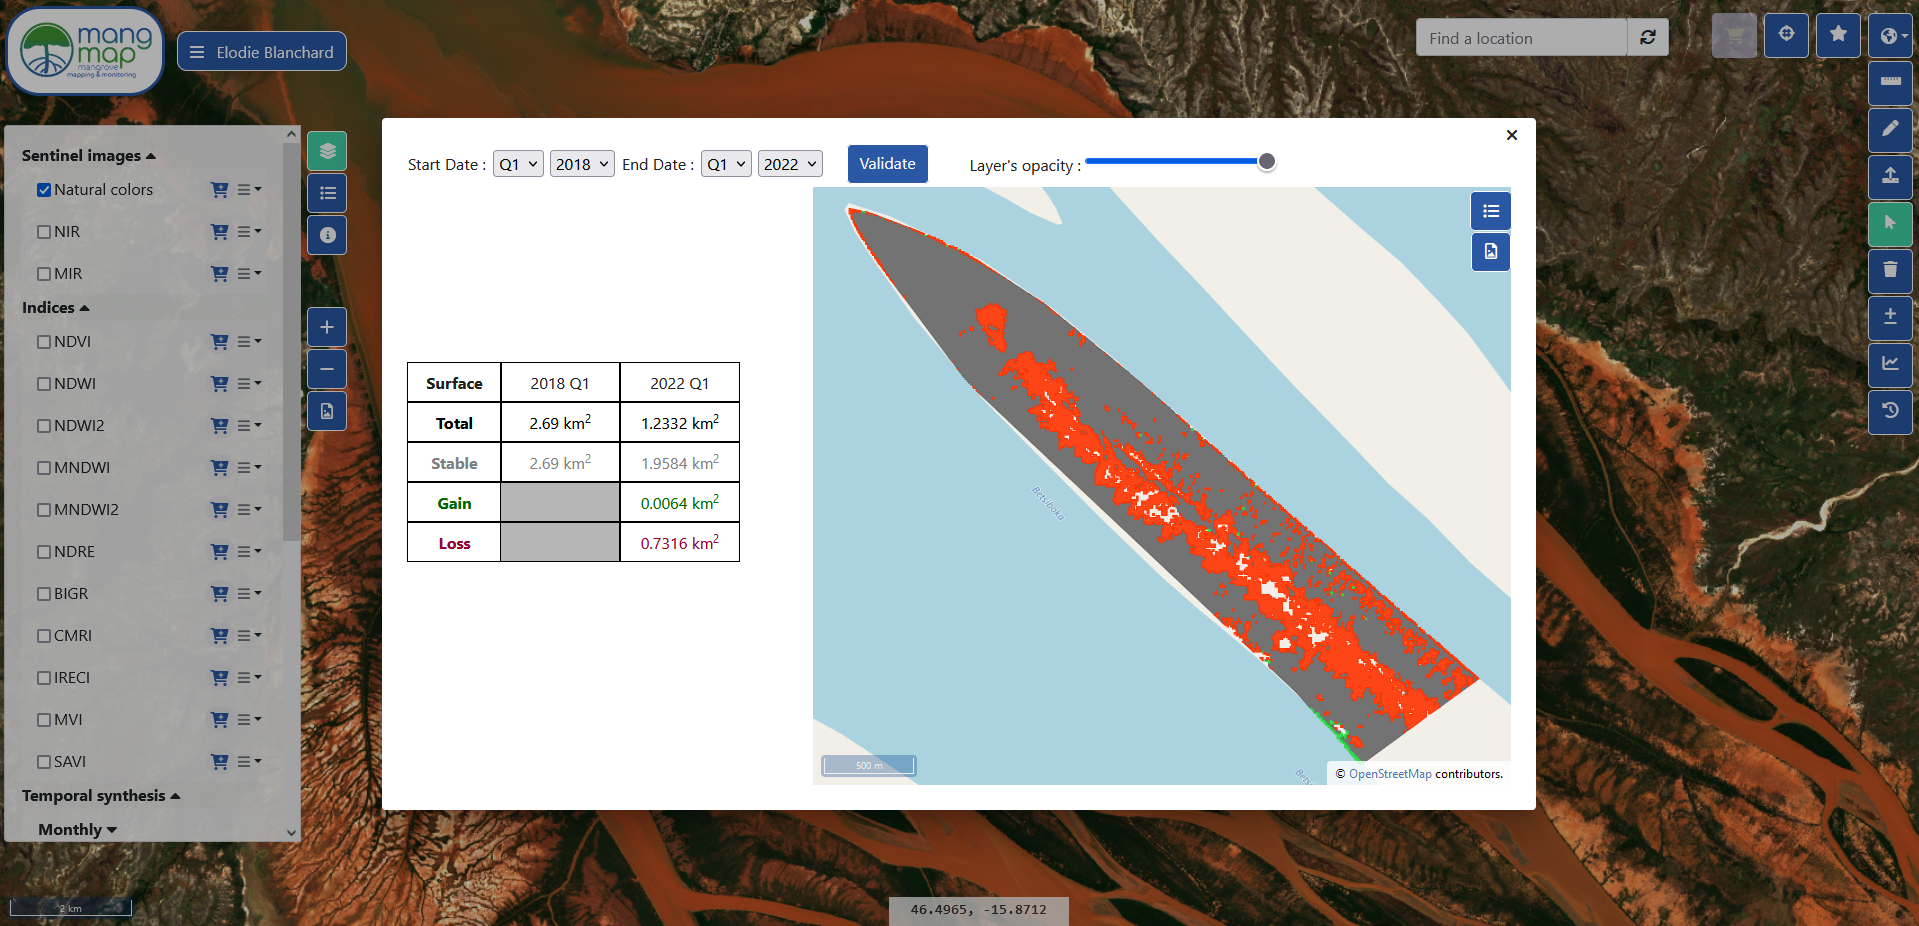
As a result, this MangMap service offers:
- On-screen display of a table showing the differences in mangrove area between the 2 selected dates: stable area, area gained and area lost
- On-screen display of a result image: stable areas in grey, areas gained in green and areas lost in red
Download all the results in PNG, JPEG and PDF format