Within each study area, 11 spectral indexes were calculated for all the L2A images generated. These indexes are calculated using the Sen2Chain algorithm. Cloudy areas are masked out. The product is a 10m resolution raster that can be viewed and downloaded in TIF format free of charge.
- Vegetation Indexes
- Vegetation Indexes linked to water content
- Vegetation Indexes linked to soil
- SAVI (Soil Adjusted Vegetation Index)
- Specific Mangroves Indexes
Vegetation Indexes
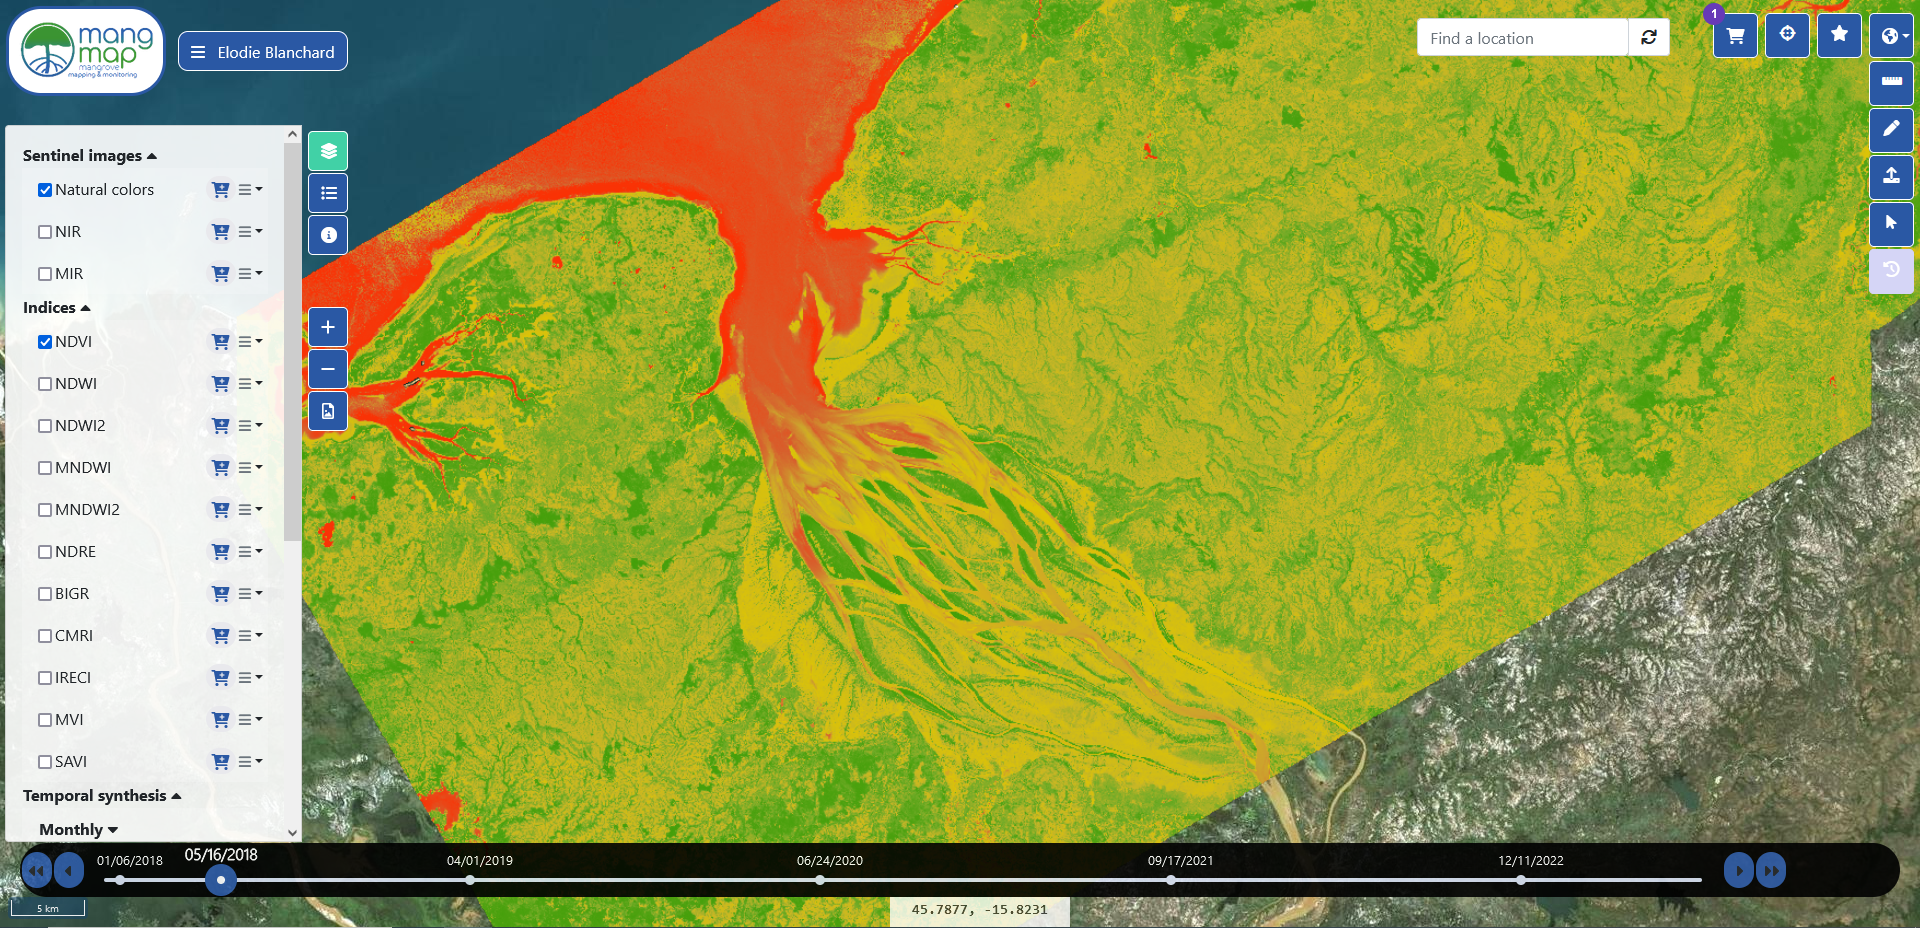
NDVI : Normalized Difference Vegetation Index
NDVI = (NIR-RED) / (NIR+RED)
NIR : bande 08
VIR : bande 04
The NDVI, proposed by Wilson and Sader 2002, is an effective index for quantifying green vegetation. It normalises the scattering of green leaves at near-infrared wavelengths with the absorption of chlorophyll at red wavelengths. It is a measure of vegetation health based on the way plants reflect light at certain wavelengths. The range of NDVI values is from -1 to 1. Negative NDVI values (values close to -1) correspond to water. Values close to zero (-0.1 to 0.1) generally correspond to barren areas of rock, sand or snow. Low and positive values represent shrubland and grassland (around 0.2 to 0.4), while high values indicate temperate and tropical rainforests (values close to 1).
Wilson, E.H. and Sader, S.A. (2002). Detection of Forest Harvest Type Using Multiple Dates of Landsat TM Imagery. Remote Sensing of Environment, 80, 385-396.
IRECI : Inverted Red-Edge Chlorophyll Index
IRECI= (REDEDGE -RED) / (RE1/RE2)
REDEDGE : bande 783nm (B7 - 20m)
RED : bande 665nm (B4 - 10m)
RE1 : bande 705nm (B5 - 20m)
RE2 : bande 740nm (B6 - 20m)
The IRECI was proposed by Frampton et al. 2013 to assess the concentration of chlorophyll in vegetation, as chlorophyll strongly absorbs red light and emits fluorescence in the REDEDGE band. Thus, the higher the chlorophyll concentration, the lower the reflectance in the REDEDGE band relative to the reflectance in the red band, and the higher the IRECI index. Using the IRECI index, it is possible to map the concentration of chlorophyll in plants. The value of the IRECI index can vary from -1 to 1, where positive values indicate a high chlorophyll concentration in plant leaves, while negative values indicate a low chlorophyll concentration. IRECI is particularly useful for assessing the health of crops and forests, as it can help detect early signs of stress. Variations in IRECI can be used to monitor forest growth, disease detection and fire surveillance, for example.
Frampton, W.J., Dash, J., Watmough, G., Milton, E.J., (2013). Evaluating the capabilities of Sentinel-2 for quantitative estimation of biophysical variables in vegetation.ISPRS Journal of Photogrammetry and Remote Sensing 82, p.83–92
NDRE : Normalized difference red edge index
NDRE = (NIR - REDEDGE) / (NIR + REDEDGE)
NIR : bande 08
REDEDGE : bande 05
NDRE is a spectral index used to assess plant vigour. The invention of the NDRE index is attributed to the Dutch company MicaSense. REDEDGE is a region of the electromagnetic spectrum between the red and near infrared bands. This region is particularly sensitive to chlorophyll and to variations in the leaf area index of plants, making it easier to distinguish differences in plant vigour. Index values range from -1 to 1, with positive values indicating high plant vigour and negative values indicating low plant vigour. The NDRE index is often used to assess crop health and agricultural productivity, as it can provide information on the amount of biomass produced by plants. It is also used for mapping plant cover and studying plant biodiversity.
Barnes, E. M., Clarke, T. R., Richards, S. E., Colaizzi, P. D., Haberland, J., Kostrzewski, M., Waller, P., Choi, C., Riley, E., Thompson, T., Lascano, R. J., Li, H., Moran, M.S., (2000). Coincident detection of crop water stress, nitrogen status and canopy density using ground based multispectral data. In Proceedings of the Fifth International Conference on Precision Agriculture, Bloomington, MN, USA (Vol. 1619)
BIGR : Brightness Index Green Red
BIGR = ((GREEN² + RED²)/2) ^ 0.5
GREEN : bande 03
RED : bande 04
BIGR is a brightness index that measures the intensity of vegetation by using a geometric transformation to combine reflectance in the green and red bands. The result is an index that can provide information about variations in the brightness and colour of the surface observed. The higher the BIGR value, the denser and more vigorous the vegetation. BIGR is used to assess the health and productivity of crops, the growth of trees and forests, and to monitor areas of natural vegetation.
Vegetation Indexes linked to water content
NDWI : Normalized difference water index (Gao)
NDWI = (NIR-SWIR1) / (NIR+SWIR1)
NIR : bande 08
SWIR1 : bande 11
The NDWI, proposed by Gao 1996, is an index sensitive to vegetation moisture levels. The numerator of the equation measures the difference in reflectance between NIR and SWIR1, which is sensitive to the presence of water. The denominator standardises this difference to avoid errors due to atmospheric and topographical variations. NDWI is used to monitor changes in leaf water content. The SWIR band reflects changes in both the water content of the vegetation and the structure of the spongy mesophyll in plant canopies, whereas NIR reflectance is affected by internal leaf structure and leaf dry matter content, but not by water content. Combining NIR with SWIR eliminates variations induced by internal leaf structure and leaf dry matter content, improving the accuracy of vegetation moisture retrieval. NDWI is also useful for monitoring water resources such as lakes, rivers and wetlands.
NDWI2 : Normalized difference water index 2 (McFleeters)
NDWI2 = (GREEN-NIR) / (GREEN+NIR)
GREEN : bande 03
NIR : bande 08
NDWI2 proposed by McFeeters in 1996 is a vegetation index based on specific wavelengths of the electromagnetic spectrum to calculate the amount of water contained in vegetation, like the NDWI. Gao's NDWI is particularly effective in assessing the amount of water contained in dense vegetation, while the NDWI2 is sensitive to the amount of water contained in less dense vegetation, whereas the NDWI is effective in assessing the amount of water contained in dense vegetation. In addition, the NDWI2 is an index often used to delineate and monitor changes in surface water content. As water masses strongly absorb light in the visible to infrared electromagnetic spectrum, NDWI2 uses green and near-infrared bands to highlight water masses.
McFEETERS, S. K. (1996). The use of the Normalized Difference Water Index (NDWI) in the delineation of open water features, International Journal of Remote Sensing, 17:7, 1425-1432.
MNDWI : Modified Normalized Difference Water Index
MNDWI = (GREEN-SWIR1) / (GREEN+SWIR1)
GREEN : bande 03
SWIR1 : bande 11
MNDWI is derived from the NDWI and was modified by Xu 2006. It uses the green and SWIR1 channels to improve the detection of water in open hydrographic features and sparsely vegetated areas. It assigns positive values to water pixels and negative values to other surface types, such as land. The higher the MNDWI value, the greater the probability that the pixel corresponds to a water area. The MNDWI is widely used for environmental monitoring, water resource management, flood mapping and other applications related to the detection of water in images.
Xu, H.Q (2006). Modification of normalized difference water index (ndwi) to enhance open water features in remotely sensed imagery. International Journal of Remote Sensing 27, pp 3025-3033.
MNDWI 2 : Modified Normalized Difference Water Index 2
MNDWI2 = (GREEN-SWIR2) / (GREEN+SWIR2)
GREEN : bande 03
SWIR2 : bande 12
MNDWI2 uses the SWIR2 spectral band, unlike the MNDWI which uses the SWIR1 spectral band. The difference between these two spectral bands lies in their ability to be absorbed by water and to detect the reflection of light in water. SWIR1 is more sensitive to the reflectance of shallow water, while SWIR2, which is more absorbed by water, can detect the presence of water in more turbid or deeper conditions. It is used, for example, to detect the presence of water in urban environments or in areas of dense vegetation.
Reddy, S. L. K., Rao, C. V., Kumar, P.R., Anjaneyulu, R. V. G., Krishna, B. G. (2018). A novel method for water and water canal extraction from Landsat-8 OLI imagery. The International Archives of the Photogrammetry, Remote Sensing and Spatial Information Sciences. XLII-5: 323-328.
SAVI : Soil Adjusted Vegetation Index
SAVI = (NIR − Red / NIR + Red + L) x (1 + L) avec L=0.5
RED : bande 04
NIR : bande 08
SAVI proposed by Huete in 1988 is a vegetation index that attempts to minimise the influences of soil brightness using a soil brightness correction factor (L). The index was proposed with L= 0.5 when the type of vegetation cover was unknown, since 0.5 represents average vegetation cover. Its creator added a soil adjustment factor L to the NDVI equation in order to correct for the effects of soil noise (soil colour, soil moisture, soil variability from one region to another, etc.), which tend to influence the results.
Huete, A. R. (1988). "A soil-adjusted vegetation index (SAVI)." Remote Sensing of Environment 25(3): 295-309.
Specific Mangrove Indexes
MVI : Mangrove Vegetation Index, Baloloy et al. (2020)
MVI = (NIR - GREEN) / (SWIR1 - GREEN)
GREEN : bande 03
NIR : bande 08
SWIR1 : bande 11
MVI is a vegetation index proposed by Baloloy et al. in 2020 for the detection of mangroves. The MVI uses the Green, NIR and SWIR1 bands to capture the particular greenness and wetness of mangroves by distinguishing them from other vegetation types and non-vegetation cover. Analysis of the spectral bands shows that |NIR-Green| captures the differences in greenness between mangrove forests and terrestrial vegetation, while |SWIR-Green| expresses the distinct wetness of mangroves. The MVI value increases with increasing probability that a pixel is classified as mangrove.
Baloloy, A. B., A. C. Blanco, et al. (2020). "Development and application of a new mangrove vegetation index (MVI) for rapid and accurate mangrove mapping." ISPRS Journal of Photogrammetry and Remote Sensing 166: 95-117.
CMRI: Combined Mangrove Recognition Index, Gupta et al. 2018
CMRI = NDVI – NDWI2
CMRI is a spectral index developed by Gupta et al. 2018 for the detection of mangroves. This index combines two other indices: NDVI and NDWI2. The combination of these two indices makes it possible to differentiate mangrove areas from other vegetation types and open water areas. Mangroves have high NDVI values due to the high density of their foliage, while their presence in areas of swamp or salt water can also be detected by the NDWI2, which is sensitive to the presence of water. CMRI was developed for Landsat images, but can also be used for images from other sensors, such as Sentinel-2.
Gupta, K., A. Mukhopadhyay, et al. (2018). "An index for discrimination of mangroves from non-mangroves using LANDSAT 8 OLI imagery." MethodsX 5: 1129-1139.